The day rooftop solar met two thirds of South Australia’s total demand
South
Australia’s renewable energy transition continues to surprise energy
experts, with the latest assessment produced by the Australian Energy
Market Operator indicating that the push towards the government target
of “net 100 per cent renewables” is accelerating rather than slowing
down.
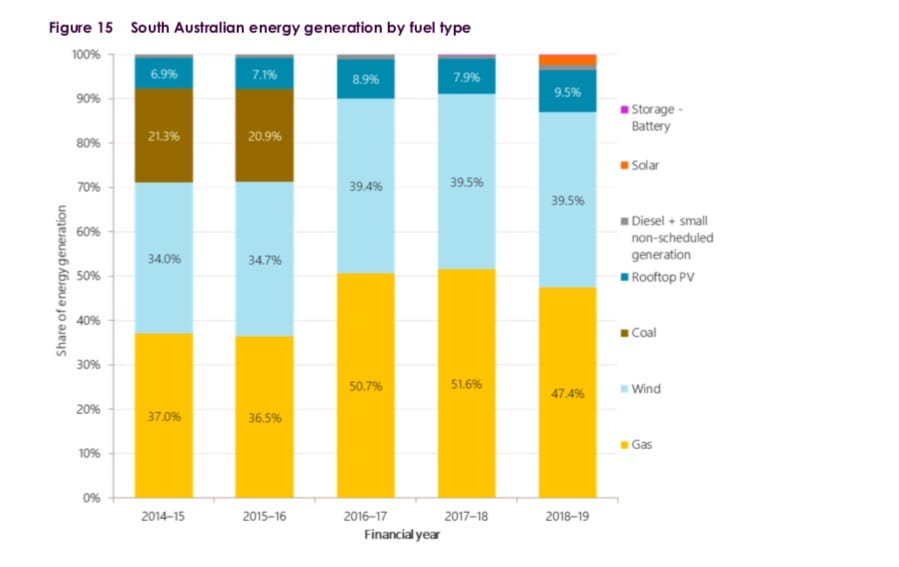
The latest South Australia Electricity Report published by AEMO on Thursday shows how far the state has come over the last 10 years: in 2018/19 the contribution of wind and solar combined to provide 52% of the state’s total generation.
The state, since closing its coal generators in 2016, has become a net exporter rather than an importer. Emissions have fallen to their lowest levels ever, the AEMO report points out.
And while the 2018/19 financial year did not paint a pretty picture on wholesale prices – thanks to some extraordinary events in the January heatwaves and the “contagion” from Victoria – prices in the last few months have been the lowest in the country.
 South
Australia’s share of “variable” renewables – wind and solar – is not
the highest in the world for a substantial grid (Denmark beats it), but
it is an achievement for a relatively isolated grid at the end of a long
stringy line.
South
Australia’s share of “variable” renewables – wind and solar – is not
the highest in the world for a substantial grid (Denmark beats it), but
it is an achievement for a relatively isolated grid at the end of a long
stringy line.
And in some areas, it is world leading. On November 10, rooftop solar accounted for an astonishing 64 per cent of the state’s “operational demand”, when the combined output from solar panels on homes and small businesses totalled 832MW at 2pm.
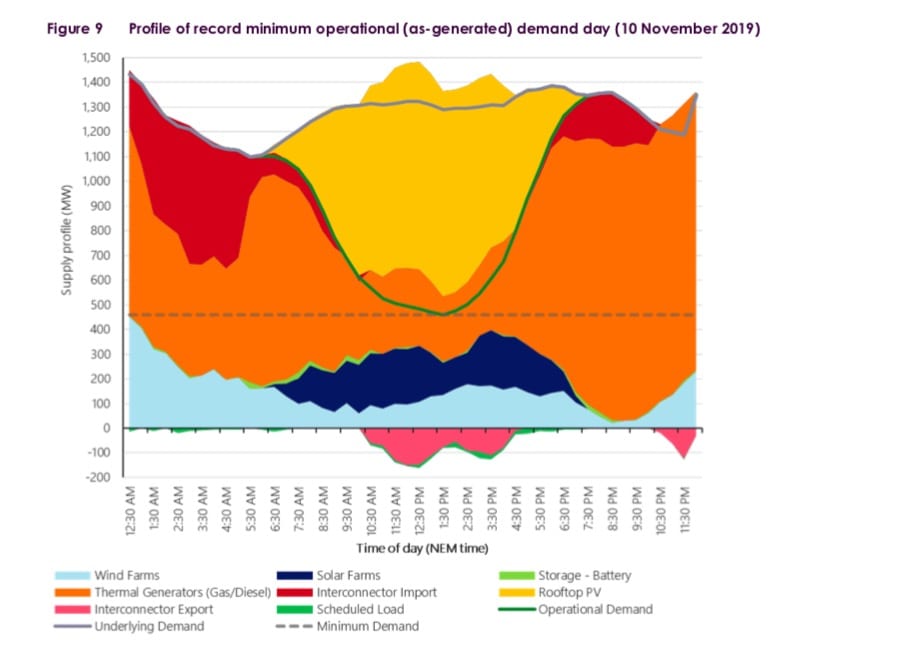
Rooftop solar has completely changed the dynamics of the local grid. It has shifted the time of minimum demand from the dead of night to the middle of the day, shoved the peak from the mid to late afternoon into the evening and after the sun has set, and created a clearly defined “duck curve” that is particularly visible in spring and winter.
“Rooftop PV contributed 50MW more at the underlying peak in 2018-19 than had been forecast the previous year, delivering 433MW at the time of peak, and keeping the time of peak grid demand to 7:30pm Adelaide time,” the report notes.
That means a lot less gas generation is needed at times, and what gas generation is required needs to be able to react quickly. That underlines the push for fast-start generators that will be rarely used, and will replace more conventional gas turbines as the level of battery storage increases, and other technology such as pumped hydro and synchronous condensers enter the system.
Solar PV contributed more than 10 per cent to local demand, but this could nearly treble over the coming decade depending on the ongoing uptake of rooftop solar.
And within four years, AEMO expects the output of rooftop solar to reach 100 per cent of operational demand, given that the accelerating uptake of the technology at both small-scale and at larger scale, where the installation on big industrial roofs and some ground mounted behind-the-meter installations is tracking at, or even above, its most optimistic forecasts.
To help balance this, South Australia is becoming a leader in the creation of “virtual power plants”, basically the aggregation – through smart controls and communication – of hundreds, or even thousands of rooftop solar and battery storage installations that can be deployed as though they were a single unit. That will also include electric vehicles.
These VPPs can be used just to inject power into the system, or provide system services such as frequency control. A trial conducted with Energy Locals and Tesla did just that earlier this month when it responded to a trip of the biggest coal unit in Queensland.
That particular VPP is likely to grow from 1,100 installations to 50,000 installation over the next decade, many of them on the roofs of low income and state housing, and will be supplemented by the state government’s own scheme to install 40,000 batteries, and other programs such as those run by Simply Energy and SA Power Networks.
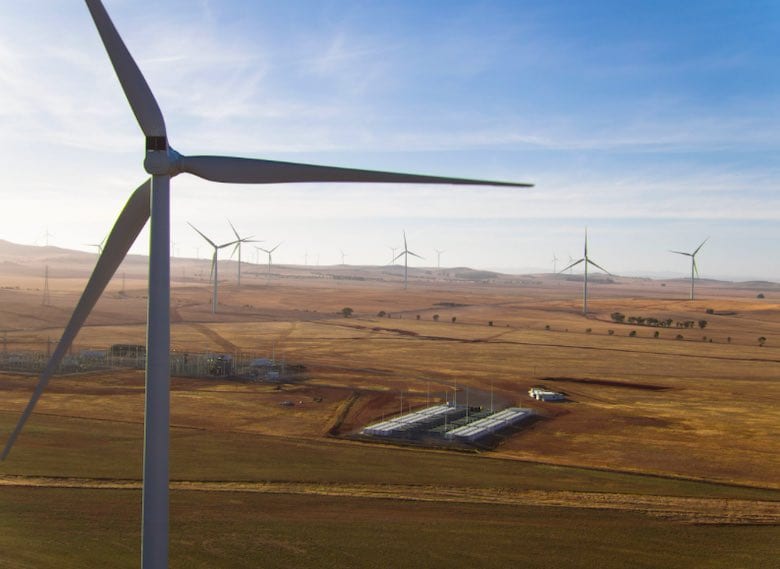
The last financial year was notable for more significant events. The addition of the Lincoln Gap and Willogoleche wind farms took its installed capacity to more than 2.14GW. Its first three large-scale solar farms entered production, another big battery entered the market, and more large scale wind and solar and storage projects joined the queue for construction.
AEMO’s pipeline of new wind and solar and storage projects is more than 10.5GW. Some private analysis puts this much higher but AEMO has stricter criteria. If just one third of these proposals are built over the next 10 years, that will be enough to meet the state Liberal government’s “net 100 per cent” renewable target.
Any more, it will be able to fulfil its bigger aspirations of becoming a major exporter of renewable energy, either the electrons themselves via transmission links, or in the form of green hydrogen, or added value products such as “green metals.”
What does this mean for reliability? The outlook for the next 10 years, according to AEMO, is that there is no anticipated breach of the reliability standards – but it can never rule out what it calls a “tail risk event,” such as when a prolonged and vicious heat wave takes out multiple gas units. Nor can it rule out contagion from neighbouring states, such as Victoria.
Indeed, it suggests the South Australia could be affected should problems occur in Victoria and authorities decided to ‘spread” the hurt among energy users. That would make for some interesting political fallout.
But in South Australia, more batteries are entering the grid, the Tesla big battery at Hornsdale is getting a 50 per cent lift in capacity, and more fast start generation is being deployed, mostly to replace some of the current ageing and slow moving gas fleet.
The emergency “diesel” back ups are being leased to Nexif Energy and Infigen and will be converted to gas and deployed actively in the market. Infigen says this will enable it to build another 300MW of “firm” wind and solar power in the state.
Just to finish with some interesting graphs.
The latest South Australia Electricity Report published by AEMO on Thursday shows how far the state has come over the last 10 years: in 2018/19 the contribution of wind and solar combined to provide 52% of the state’s total generation.
The state, since closing its coal generators in 2016, has become a net exporter rather than an importer. Emissions have fallen to their lowest levels ever, the AEMO report points out.
And while the 2018/19 financial year did not paint a pretty picture on wholesale prices – thanks to some extraordinary events in the January heatwaves and the “contagion” from Victoria – prices in the last few months have been the lowest in the country.
South
Australia’s share of “variable” renewables – wind and solar – is not
the highest in the world for a substantial grid (Denmark beats it), but
it is an achievement for a relatively isolated grid at the end of a long
stringy line.And in some areas, it is world leading. On November 10, rooftop solar accounted for an astonishing 64 per cent of the state’s “operational demand”, when the combined output from solar panels on homes and small businesses totalled 832MW at 2pm.
Rooftop solar has completely changed the dynamics of the local grid. It has shifted the time of minimum demand from the dead of night to the middle of the day, shoved the peak from the mid to late afternoon into the evening and after the sun has set, and created a clearly defined “duck curve” that is particularly visible in spring and winter.
“Rooftop PV contributed 50MW more at the underlying peak in 2018-19 than had been forecast the previous year, delivering 433MW at the time of peak, and keeping the time of peak grid demand to 7:30pm Adelaide time,” the report notes.
That means a lot less gas generation is needed at times, and what gas generation is required needs to be able to react quickly. That underlines the push for fast-start generators that will be rarely used, and will replace more conventional gas turbines as the level of battery storage increases, and other technology such as pumped hydro and synchronous condensers enter the system.
Solar PV contributed more than 10 per cent to local demand, but this could nearly treble over the coming decade depending on the ongoing uptake of rooftop solar.
And within four years, AEMO expects the output of rooftop solar to reach 100 per cent of operational demand, given that the accelerating uptake of the technology at both small-scale and at larger scale, where the installation on big industrial roofs and some ground mounted behind-the-meter installations is tracking at, or even above, its most optimistic forecasts.
To help balance this, South Australia is becoming a leader in the creation of “virtual power plants”, basically the aggregation – through smart controls and communication – of hundreds, or even thousands of rooftop solar and battery storage installations that can be deployed as though they were a single unit. That will also include electric vehicles.
These VPPs can be used just to inject power into the system, or provide system services such as frequency control. A trial conducted with Energy Locals and Tesla did just that earlier this month when it responded to a trip of the biggest coal unit in Queensland.
That particular VPP is likely to grow from 1,100 installations to 50,000 installation over the next decade, many of them on the roofs of low income and state housing, and will be supplemented by the state government’s own scheme to install 40,000 batteries, and other programs such as those run by Simply Energy and SA Power Networks.
The last financial year was notable for more significant events. The addition of the Lincoln Gap and Willogoleche wind farms took its installed capacity to more than 2.14GW. Its first three large-scale solar farms entered production, another big battery entered the market, and more large scale wind and solar and storage projects joined the queue for construction.
AEMO’s pipeline of new wind and solar and storage projects is more than 10.5GW. Some private analysis puts this much higher but AEMO has stricter criteria. If just one third of these proposals are built over the next 10 years, that will be enough to meet the state Liberal government’s “net 100 per cent” renewable target.
Any more, it will be able to fulfil its bigger aspirations of becoming a major exporter of renewable energy, either the electrons themselves via transmission links, or in the form of green hydrogen, or added value products such as “green metals.”
What does this mean for reliability? The outlook for the next 10 years, according to AEMO, is that there is no anticipated breach of the reliability standards – but it can never rule out what it calls a “tail risk event,” such as when a prolonged and vicious heat wave takes out multiple gas units. Nor can it rule out contagion from neighbouring states, such as Victoria.
Indeed, it suggests the South Australia could be affected should problems occur in Victoria and authorities decided to ‘spread” the hurt among energy users. That would make for some interesting political fallout.
But in South Australia, more batteries are entering the grid, the Tesla big battery at Hornsdale is getting a 50 per cent lift in capacity, and more fast start generation is being deployed, mostly to replace some of the current ageing and slow moving gas fleet.
The emergency “diesel” back ups are being leased to Nexif Energy and Infigen and will be converted to gas and deployed actively in the market. Infigen says this will enable it to build another 300MW of “firm” wind and solar power in the state.
Just to finish with some interesting graphs.
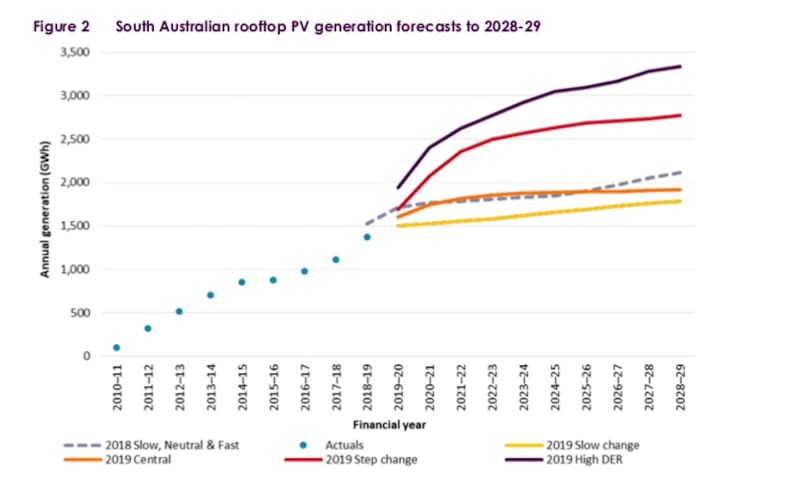 Figure
2 shows the estimated actual and forecast of annual rooftop PV
generation for South Australia from 2010-11 to 2028-29. The current
uptake is already tracking well ahead of AEMO’s “central” scenario and a
different category of larger scale rooftop PV (on industrial rooftops)
iscurrently tracking to meet or exceed the “Step change” forecast.
Figure
2 shows the estimated actual and forecast of annual rooftop PV
generation for South Australia from 2010-11 to 2028-29. The current
uptake is already tracking well ahead of AEMO’s “central” scenario and a
different category of larger scale rooftop PV (on industrial rooftops)
iscurrently tracking to meet or exceed the “Step change” forecast.
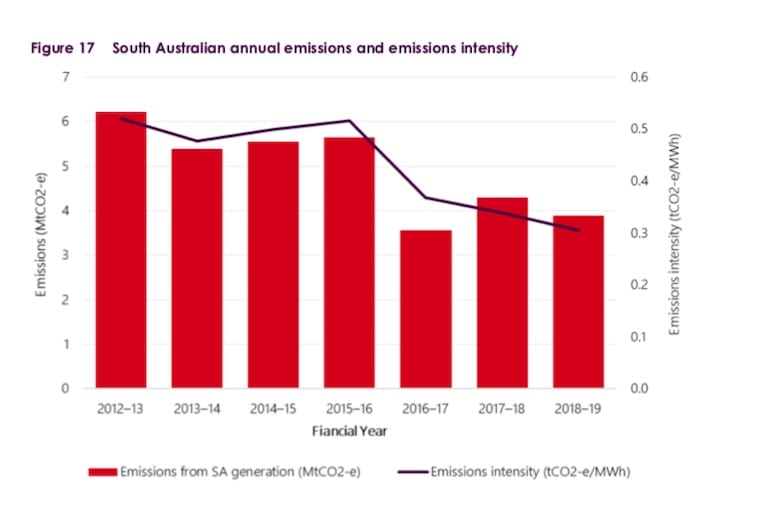
This shows the emissions and emissions intensity from South Australia, which is clearly falling.
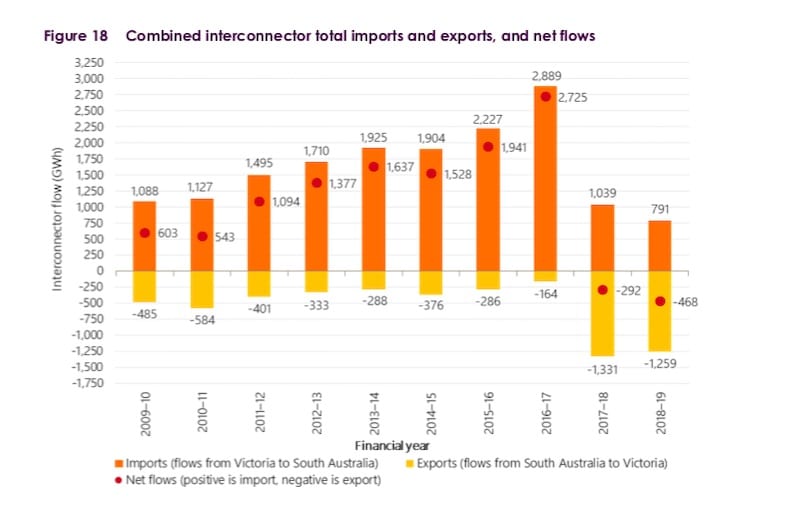
This
is a useful graph to dispel one of the big myths, namely that South
Australia is more reliant on imports from other states after the closure
of its coal generators.
Actually, it’s not. It imports less from Victoria and exports more.

And finally, this is the average import/export flow on the main inter-connector to Victoria. From early morning to late at night, South Australia usually exports to its neighbour Victoria, the state heavily dependent on highly polluting brown coal generators.
Actually, it’s not. It imports less from Victoria and exports more.
And finally, this is the average import/export flow on the main inter-connector to Victoria. From early morning to late at night, South Australia usually exports to its neighbour Victoria, the state heavily dependent on highly polluting brown coal generators.
Giles Parkinson is founder and editor of Renew Economy, and is also the founder of One Step Off The Grid and founder/editor of The Driven. Giles has been a journalist for 35 years and is a former business and deputy editor of the Australian Financial Review.


-
UNSW student-designed solar freezer installed on remote Fiji islandby Sophie Vorrath on 28 November 2019 at 10:46 AM
-
Winners and losers from Victoria’s rooftop solar rebate schemeby Nigel Morris on 28 November 2019 at 9:47 AM
-
Solar and battery microgrid achieves 90% renewables for W.A. gas hubby Sophie Vorrath on 26 November 2019 at 3:03 PM
-
The Driven Podcast: Why your EV will also be a “virtual power plant”by Giles Parkinson on 29 November 2019 at 2:41 PM
-
Audi technical update adds 25km to e-tron all-electric SUVby Bridie Schmidt on 29 November 2019 at 2:27 PM
-
Tesla Model S busts EV myths with historic 1 million kilometres drivenby Bridie Schmidt on 29 November 2019 at 1:53 PM
We Recommend
Victoria 50% by 2030 renewable energy target voted...Climate,Governments,Renewables
Meridian Energy announces new Chief Executive of M...Press Releases
South Australia Liberals celebrate nation-leading ...Governments,News & Commentary
AEMC told to go back and consult on Cogati, but ML...Governments,Renewables,Solar
Other states should follow NSW demand reduction sc...Governments
Finkel’s national hydrogen strategy gets green lig...CleanTech Bites,Governments,Renewables
:quality(85)/https%3A%2F%2Freneweconomy.com.au%2Fwp-content%2Fuploads%2F2018%2F05%2FArarat-Wind-Farm-Australia-14-3000px-copy-3-300x255.jpg "Victoria 50% by 2030 renewable energy target voted into law")
:quality(85)/https%3A%2F%2Freneweconomy.com.au%2Fwp-content%2Fuploads%2F2019%2F11%2Fmeridian_secondary_vert_rgb_blue-248x300.jpg "Meridian Energy announces new Chief Executive of Meridian Australia")
:quality(85)/https%3A%2F%2Freneweconomy.com.au%2Fwp-content%2Fuploads%2F2019%2F11%2FClimate-Council-State-of-Play-score-card-300x163.jpg "South Australia Liberals celebrate nation-leading switch to wind, solar and storage")
:quality(85)/https%3A%2F%2Freneweconomy.com.au%2Fwp-content%2Fuploads%2F2019%2F10%2F3-1000-x-450-300x135.jpg "AEMC told to go back and consult on Cogati, but MLFs still a battle zone")
:quality(85)/https%3A%2F%2Freneweconomy.com.au%2Fwp-content%2Fuploads%2F2019%2F06%2Felectricity-network-coag-energy-council-300x169.jpg "Other states should follow NSW demand reduction scheme with PERCs and DREDs")
:quality(85)/https%3A%2F%2Freneweconomy.com.au%2Fwp-content%2Fuploads%2F2019%2F11%2Ffinkel-hydrogen-clean-energy-summit-coag-energy-council-optimised-300x168.jpg "Finkel’s national hydrogen strategy gets green light, but could be lifeline for coal")


No comments:
Post a Comment